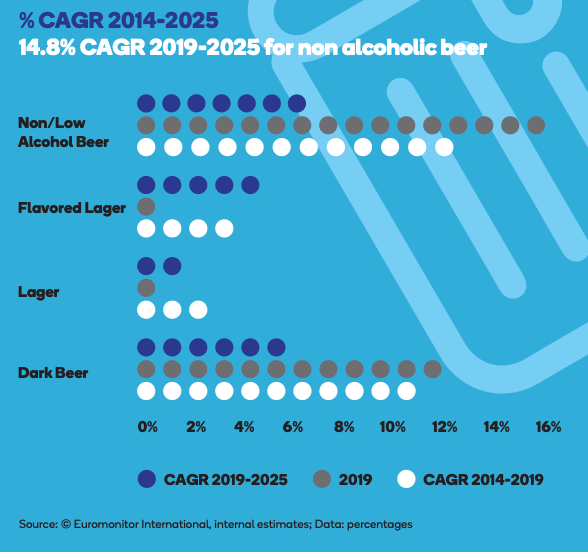
As Beer remained the most consumed alcoholic drink in Romania due to long-standing consumption habits, the popularity of domestic brands and strong activity by international players, the total volume sales continued to grow in the year before the pandemic, although more slowly than any time in the last five years. How did the category grow? Non-alcoholic beer, previously boosted by the launch of various fruit-flavoured products, was the most dynamic category in 2019 in total volume growth terms, further underlining the wide-reaching popularity of beer as many consumers’ drink of choice. Beer is expected to record low total volume growth for the forecast period as a whole, with non-alcoholic beer and dark offering the best prospects for total volume growth.
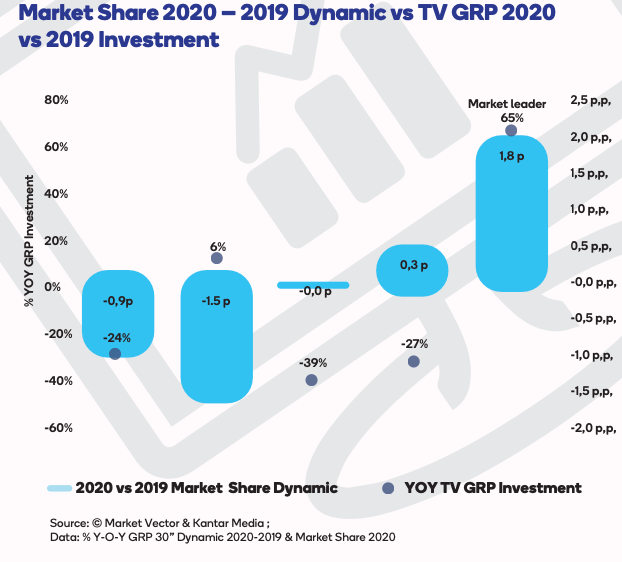
The beer market continued to grow in the pre-pandemic year as well, but it decelerated by one percentage point along with the TV investment, which decreased in volume by 21%. In 2020, the market leader increased its airtime 0% by 65% compared to 2019, and this led to an increase in the share of voice in the category from 15% -20% to more than 24%.
The investment increase was among the main reasons for the market share increase of 1.8 p.p. compared to 2019, representing more than 77% of the two main competitors’ loss.
Most brands decreased their TV investments in 2020 while losing market share. The market leader increased its TV spending volume by 35% compared to the prior year and managed to decrease by half of the market average. Fourth place on the market last year increased its TV spendings by 56% compared to the prior year and managed to gain 2 p.p. in market share, becoming the third player.
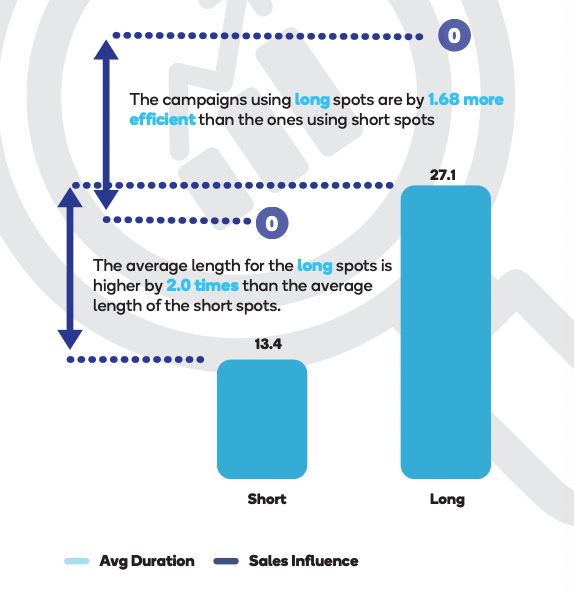
The short spots gained in share in the last years as the TV channels were sold out. The maximum weight was reached in 2019 when the equivalent GRPs brought by the short spots of advertisers in the beer sector represented almost one-quarter of the entire industry spend. In 2020 the short spots lost momentum once the SOR of the TV channels decreased as some advertisers temporarily reduced their communication in the summer.
The all time peak in the short form of the spots weight was reached in March 2020: 42%. In the third quarter, the weight in the audience of the short spots returned to pre-pandemic levels: 22%. In the analysis, we used four years of monthly sold volume data by brand provided by Market Vector. We used least squares regression to fit a generalized linear model and compute the influence of the TV investment in sales variation.
As expected, the TV investment alone explains less than 10% of the total variation in sales (the rest comes from promotions and other types of media investment).
Featured products
 All Publicis Groupe Romania proprietary data tools in one place.
Discover the power of our tools and feel free to get in touch.


